
In a previous post we examined how back test results could be summarized for different market types. In today’s post, we’ll look at how we can use that information to tune our strategy for live trading.
As the basis for this exercise, we will use a modified version of the short mean reversion strategy known to Trading Markets customers as Bear Over-Reaction. While I cannot divulge all the specifics of this proprietary system, the basic rules are as follows:
A Setup occurs when:
- Stock is a current member of the Russell 1000
- Closing price is greater than $10
- 21-day average volume is greater than 2.5M
- The stock has closed higher for [3,4,5] days in a row
- Today’s close is greater that [50,75] % of the range between today’s low and high
Short the stock on the day following Setup using a limit order [2,4,6,8] % above the Setup close. Up to 5 open positions are allowed, with 20% of available equity allocated to each position.
When any of the following conditions occur on the close, Cover the position at the next open:
- Two-period RSI is less than 30
- An EOD Stop Loss [10,25] % above the entry price
- An EOD Profit Target [5,10,15] % below the entry price
- A Time Stop when the trade has been open for 15 trading days
The values shown inside square brackets are the parameters that we will test during our AmiBroker optimization. Note that 3 x 2 x 4 x 2 x 3 gives us 144 unique parameter combinations or strategy variations.
To begin, we will test each of the 144 variations from 1/1/2000 through 12/31/2010. Summary results for the 10 variations with the highest Compound Annual Return (CAR) are shown in the table below.
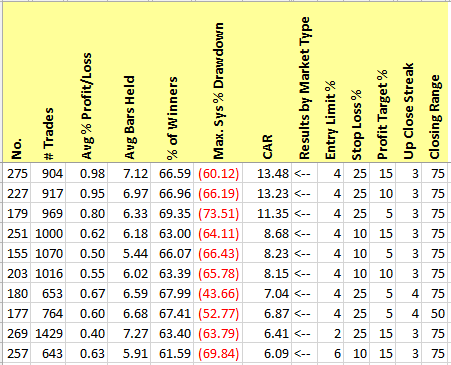
While the return numbers are not bad, the Max Drawdown (MDD) values are pretty scary. Not too many traders have the stomach to lose 60-70% of their trading capital. Even so, this gives us a place to start.
Now let’s jump ahead and see how these top performers did over the next 5+years, from January 1, 2001 through January 31, 2016:
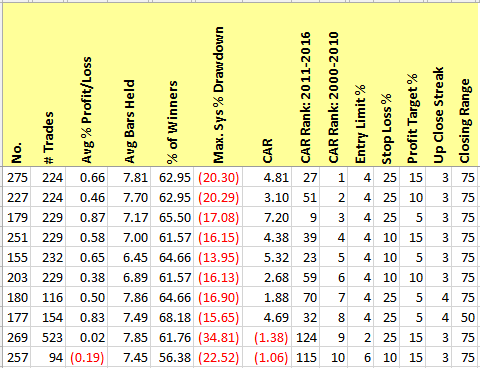
Uh oh! Here we see proof of the ever-popular warning “past performance is not a guarantee of future results”. Of the Top 10 variations for our initial 11-year test period, only one of those variations was still in the top ten over the next 5 years (variation 179). The new Top 10, shown below, uses different combinations of the parameter values:

The worst part is that we had no way to predict which variations would be the most successful following our initial testing. The best CAR was produced by the variation that ranked 19th over the previous test period! This is where looking at different market conditions or types can help.
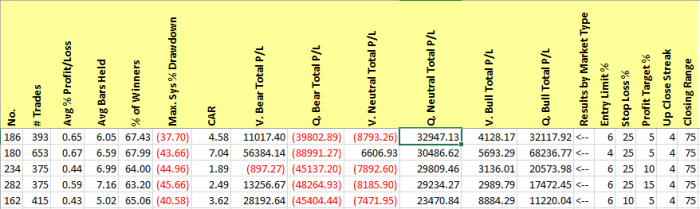
Going back to our results from 2000-2011, we will now add columns for each of six market types: Bear, Neutral, or Bull for market price action, and Quiet or Volatile for market volatility. For each market type, we have summarized the total dollars of Profit/Loss for trades whose Setup occurred when that market type was in effect.
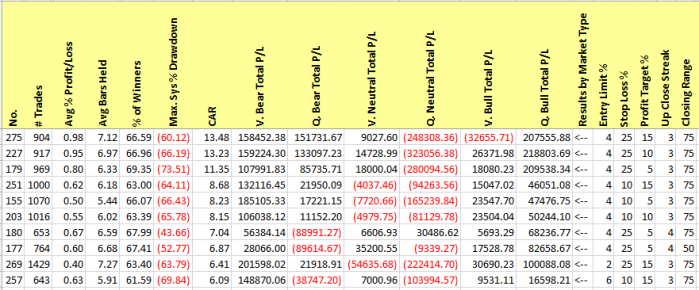
Notice that variation 275, which produced the highest overall CAR, also produced a decent amount of profit in Bear markets as well as Quiet Bull markets. However, it was more or less break even in Volatile Neutral markets, and lost lots of money in Quiet Neutral and Volatile Bull markets.
Instead of selecting one set of input parameters (i.e. one variation) to trade in all markets, what if we tried to use the best parameters for each market type. You could define “best” any number of ways, but for now we’ll stick with the very simple metric of total dollars of profit. If we re-sort our results to show the variations with the highest total P/L for V. Bear markets, we get:
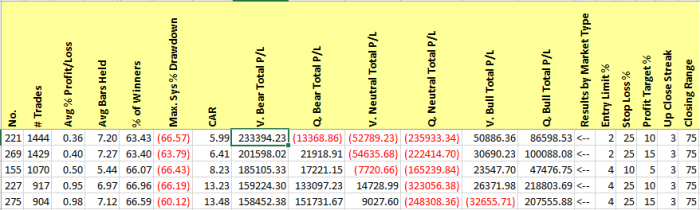
In our strategy optimized for market type, on any day classified as Volatile Bear we would use an Up Close Streak of 3 days and a Closing Range of 75% for the Setup. We would then enter the trade on a 2% limit order, and use a stop loss of 25% and a profit target of 10%.
Repeating the process for the Quiet Bear market type, we see:

Therefore, on Quiet Bear days our Setup would also require an Up Close Streak of 3 days and a Closing Range of 75%, just like the Volatile Bear Setup. However, the limit entry would be 4% above the Setup close, and the stop loss would be at 25% and the profit target at 15%.
Repeating yet again for the Quiet Neutral market type, our results show:
Now we can see that there are actually variations that have done well in this market type. On Quiet Neutral days, our Setup would be defined by a 4-day Up Close streak and a 75% Closing range. We would enter on a 6% limit order, with stops and targets of 25% and 5% respectively.
We continue this process for the remaining market types, and then combine the strategy parameters for each market type into one optimized strategy. Keep in mind that all of our strategy parameters were selected based on the back test results from 2000-2010.
So how does our optimized strategy perform from 2011 through January 2016?
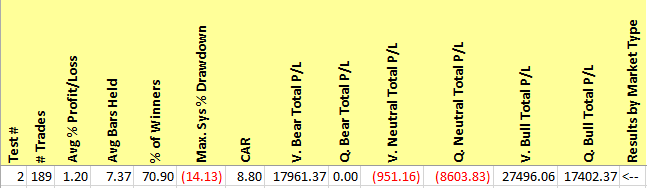
The Neutral market types still lost money. However, compare these results to Table 2, which showed how the former Top 10 from 2000-2010 performed from 2011 through January 2016. The optimized results shown in Table 8 had a higher CAR than any shown in Table 2, and had lower MDD than all but one of those variations. Best of all, we actually had a systematic way of selecting our strategy parameters.
In this example, we used a very simple method for defining the “best” results for each market type: the largest profit. We did not take into account drawdowns or any other factors that might be important to you when you trade. With additional thought and testing, it’s likely that we could improve on how to select the best variations for each market type. In addition, we would probably repeat the baselining process on a periodic basis rather than doing it just once and then using those “optimized” parameters for the next five years. Hopefully this article has given you some ideas on how to tune your own strategies for market conditions. As always, you can contact me if you need assistance.


